
A data-led reference guide derived from the Top Brand Agencies global shortlist, agency directory and published evaluation methodology.
The headline finding
Top branding agency pricing is both premium and difficult to compare. In the October 2026 global shortlist, 9 of 12 agencies with a numeric minimum project budget list at least $100,000. Just 6 of the 13 list a numeric hourly rate. Meanwhile, the editorial review-evidence dimension never reaches its maximum score in this group.
These figures describe the agencies published by Top Brand Agencies, not a representative census of every branding firm in the global market.
What is inside
01 Minimum project budgets and price tiers
02 Hourly-rate transparency and procurement implications
03 Editorial scores and the public-review evidence gap
04 Agency age, operating scale and market maturity
05 The Top Brand Agencies research footprint
06 Complete underlying data, methods and citations
Research snapshot: 8 October 2026. Financial values are published agency minimums, not audited fees, market averages, or realized project spend.
01 / PROJECT BUDGETS
How much do leading branding agencies charge?
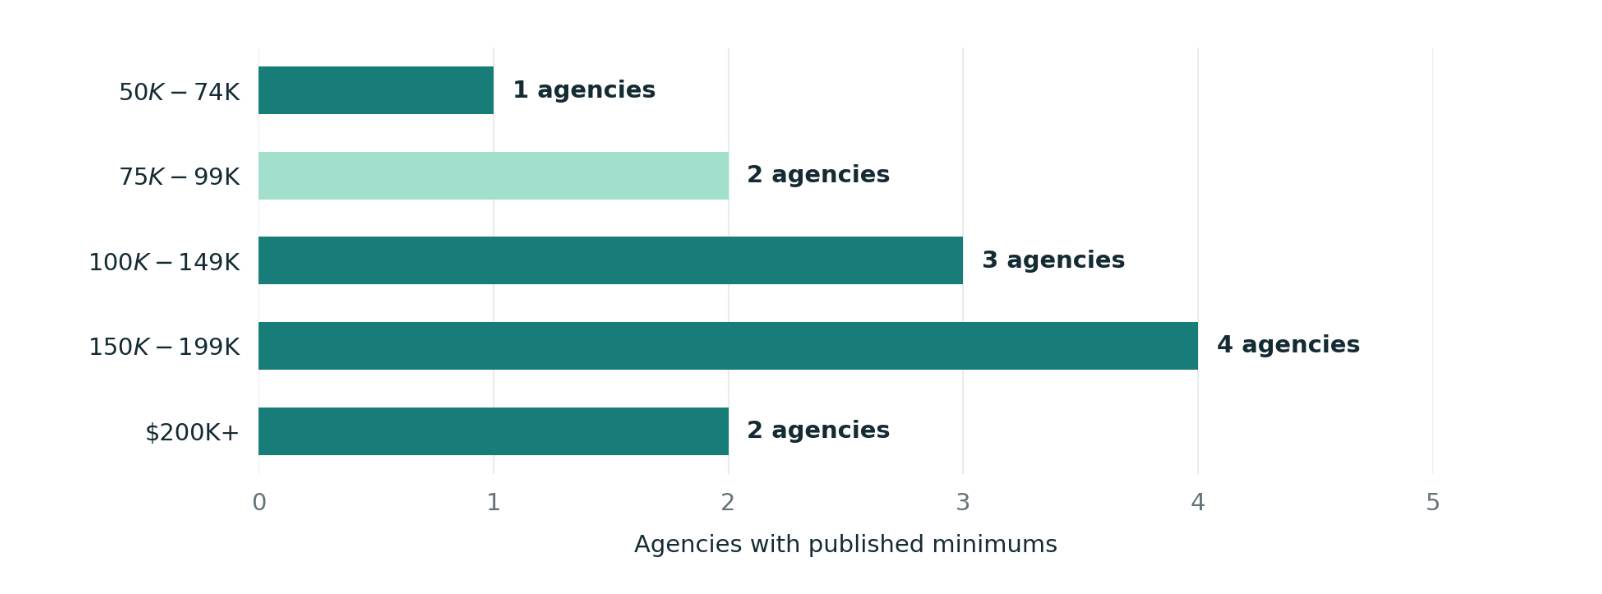
The minimum project budget listed for a global-shortlist agency varies from $50,000 to $250,000 in the numerical records used here. The median published floor across 12 agencies is $125,000. One agency is excluded from the budget median because the global-ranking page labels its budget “Flexible.”
| Published minimum | Agencies | Share of priced agencies |
|---|---|---|
| $50K-$74K | 1 | 8% |
| $75K-$99K | 2 | 17% |
| $100K-$149K | 3 | 25% |
| $150K-$199K | 4 | 33% |
| $200K+ | 2 | 17% |
What the numbers mean
A published minimum is an entry threshold, not an estimate of the most common project invoice. It is useful for initial agency qualification, but actual scope, deliverables and market conditions can move the final proposal substantially. Buyers should request comparable statements of work before comparing quotations.
Key statistic: 6 of 12 agencies (50%) publish minimums of $150K or more. Percentages refer only to records with numeric minimums.
02 / PRICING TRANSPARENCY
Hourly rates are not always comparable
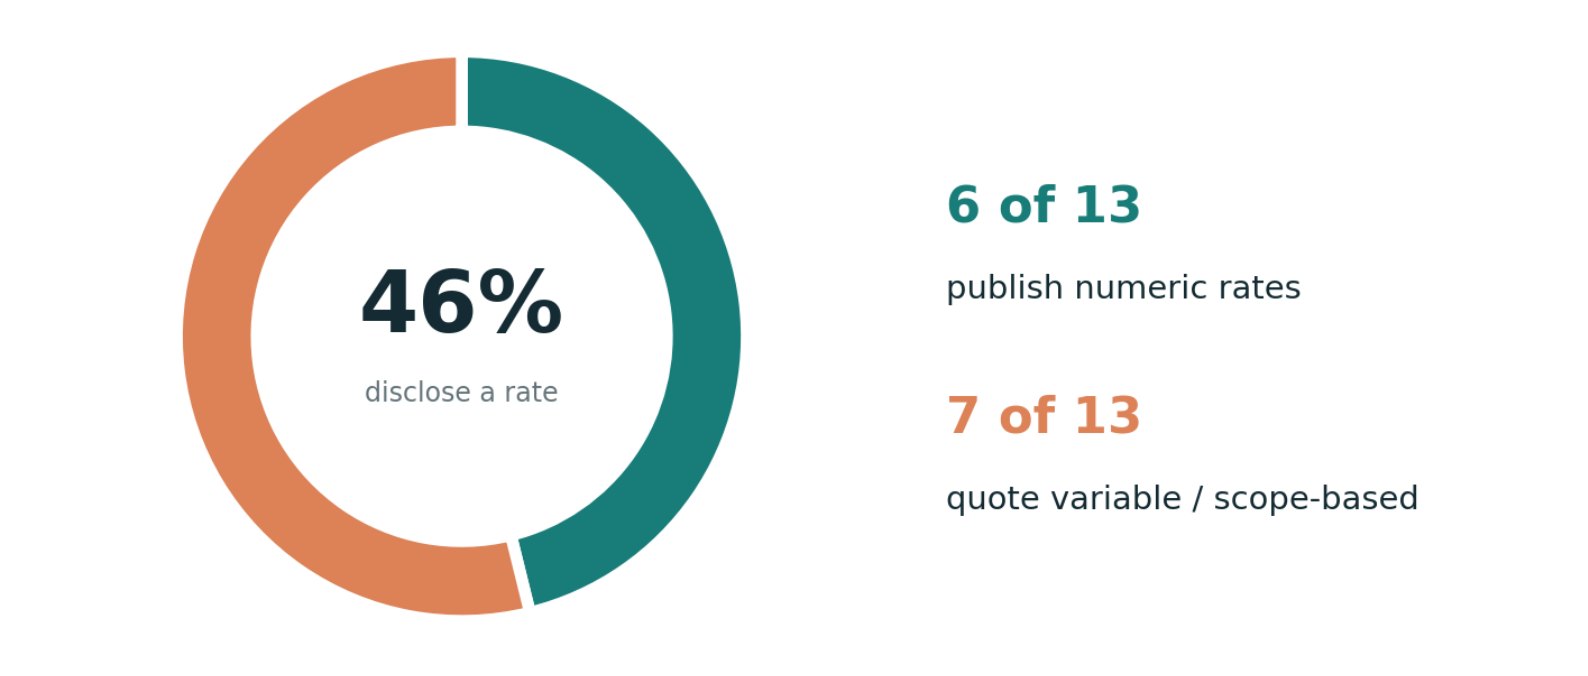
In the October global ranking, six agencies publish at least one numeric hourly price or range, while seven describe rates as variable by office, market or project scope. Large networks and consultancies are especially likely to use scope-dependent pricing language.
| Published minimum | Agencies | Share of priced agencies |
|---|---|---|
| $50K-$74K | 1 | 8% |
| $75K-$99K | 2 | 17% |
| $100K-$149K | 3 | 25% |
| $150K-$199K | 4 | 33% |
| $200K+ | 2 | 17% |
Budget floors by editorial score
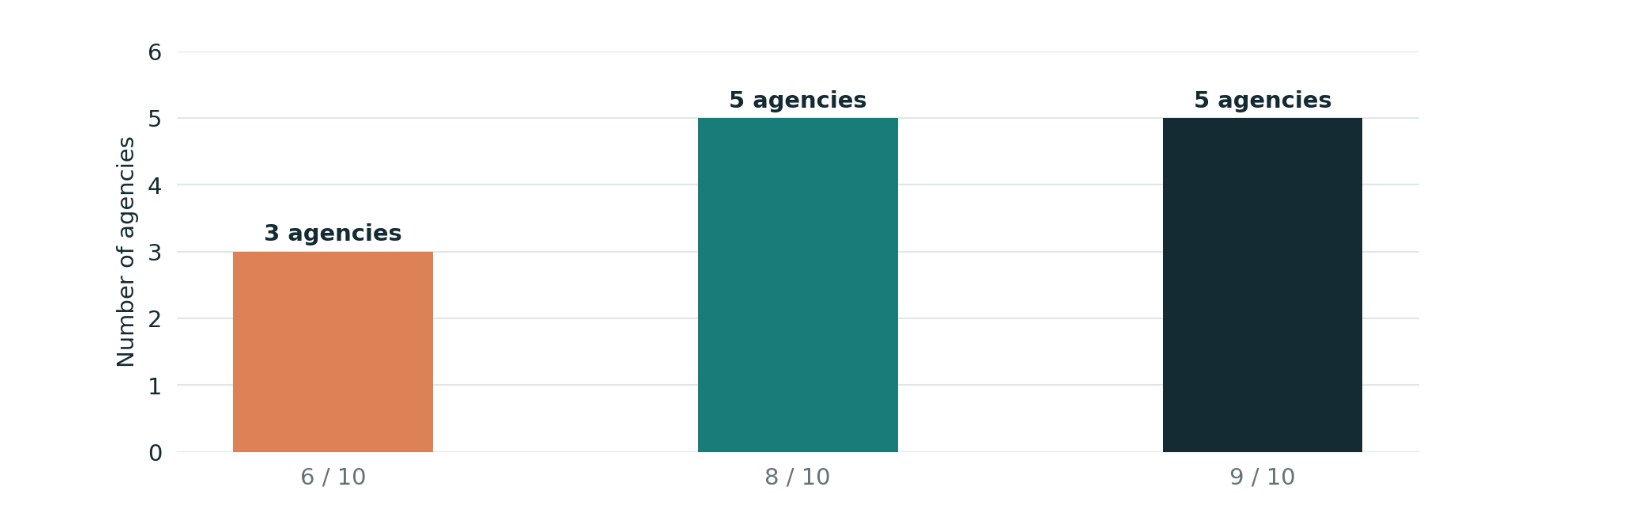
The same data show why price should not be treated as a proxy for quality. Agencies scoring 8/10 and 9/10 both have a $150,000 median listed minimum in their priced subsets. Agencies scoring 6/10 have a $75,000 median floor.
| Editorial score | Priced agencies | Median listed minimum |
|---|---|---|
| 9/10 | 5 | $150,000 |
| 8/10 | 4 | $150,000 |
| 6/10 | 3 | $75,000 |
Buyer checklist
Ask agencies to specify whether their minimum covers strategy, naming, verbal and visual identity, brand guidelines, digital design, implementation, and post-launch support. Request milestone definitions and change-order rules as well as a headline price.
03 / QUALITY AND TRUST
The review-evidence gap
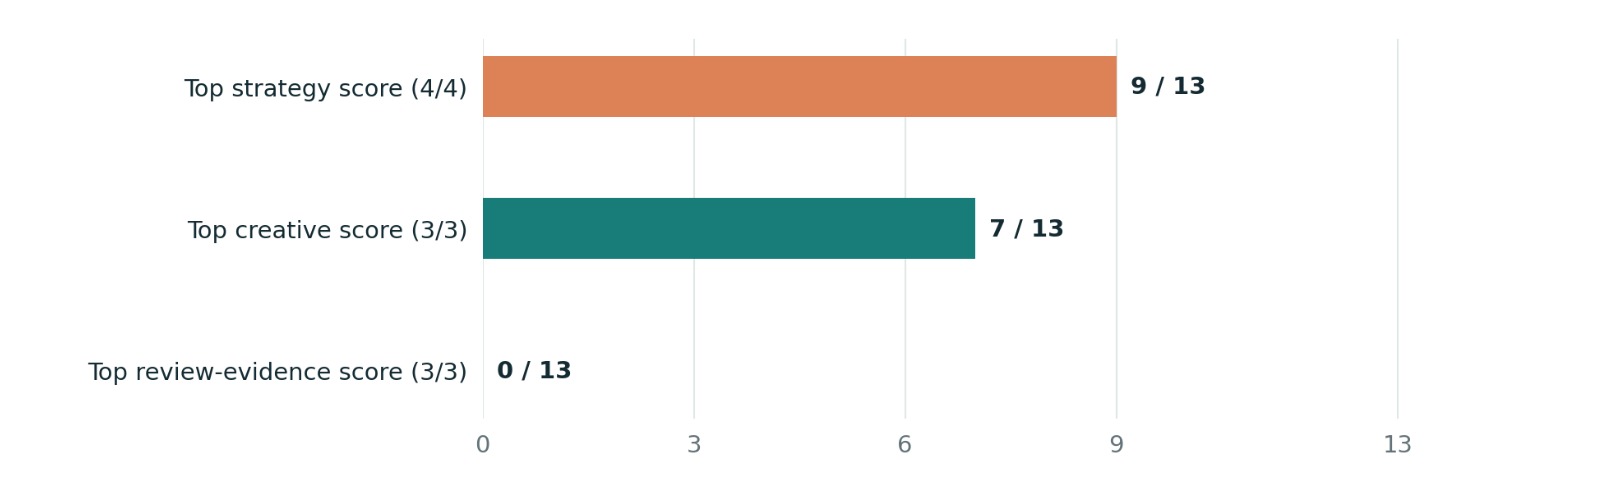
A distinctive Top Brand Agencies insight comes from its own editorial rubric. The methodology assigns up to four points for strategy and creative fit, three for creative quality, and three for reviews and feedback. In the 13-agency global shortlist, no agency earned the maximum three review points.
How full editorial scores are distributed
Nine agencies receive two of three review points, while four receive one. This should not be misread as a finding that none has real clients or independent reviews. The metric reflects the publication’s assessment of the depth, accessibility and relevance of evidence available for each agency.
04 / AGE AND OPERATING SCALE
A mix of legacy networks and young studios
The founding years listed for the 13 global agencies run from 1891 to 2025. The median founding year is 2003, equivalent to roughly 23 years before the report date. Seven of the 13 were founded in 2000 or later, based on the year labels used in the ranking.
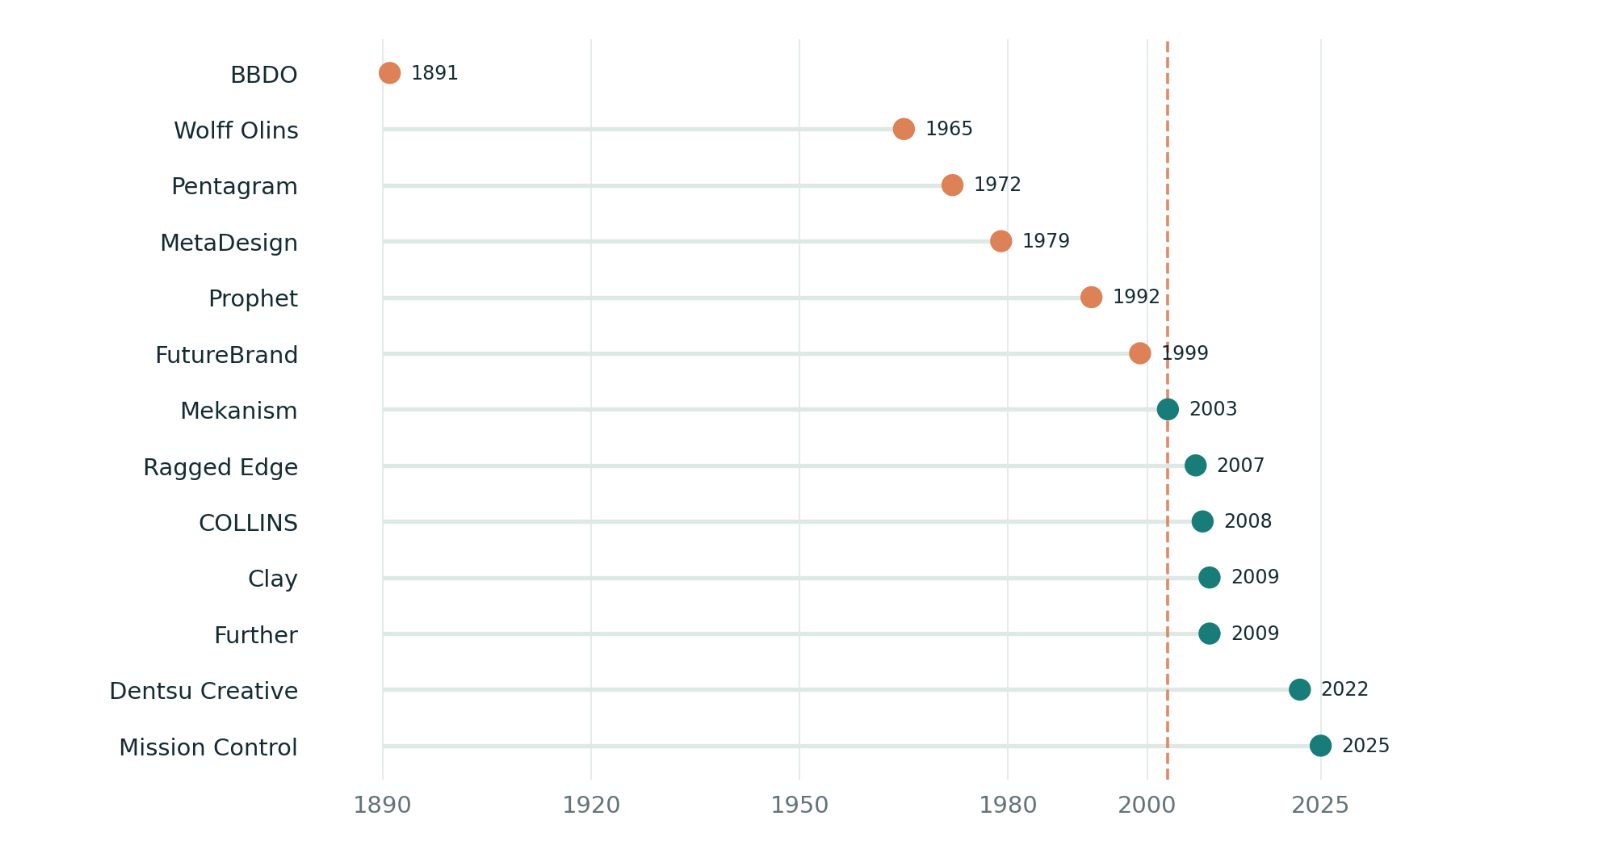
9 of 13 have a published team-size descriptor of at least 100 people, illustrating the global shortlist’s concentration of large organizations.
Age needs a qualification for consolidated groups. Dentsu Creative is counted from its 2022 launch as a unified brand, rather than from Dentsu Group’s earlier origins. Similarly, agency renamings and mergers can affect comparisons between reported founding dates.
05 / WEBSITE-WIDE RESEARCH FOOTPRINT
The site-wide editorial dataset
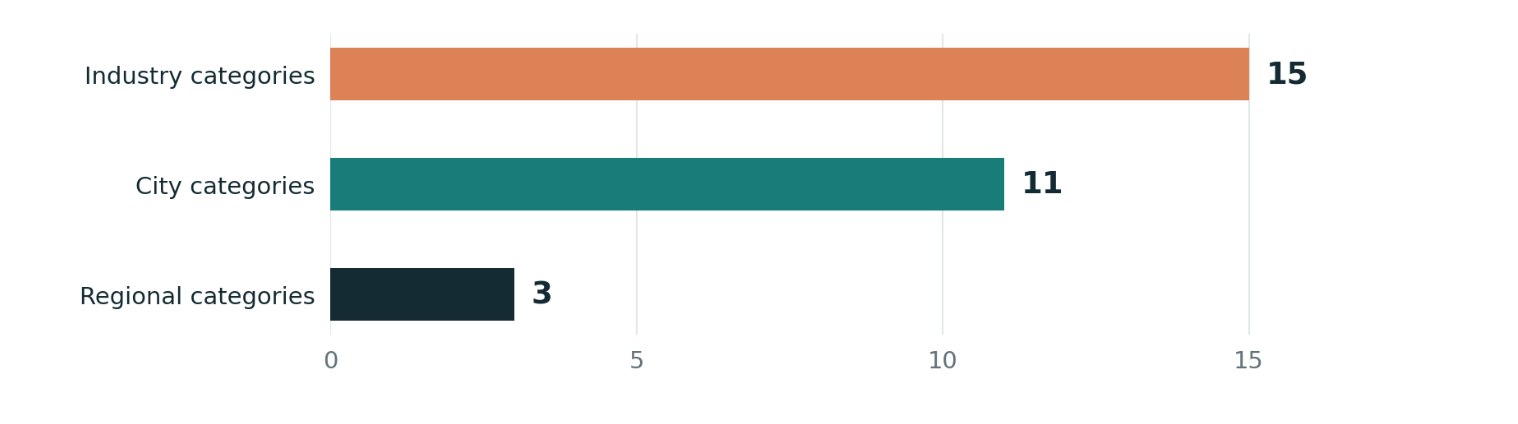
Alongside its global ranking, Top Brand Agencies maintains an agency-profile directory with 49 linked profile entries and a navigation structure spanning 29 industry, city and regional discovery categories. This inventory shows the potential research base for a recurring benchmark series.
What the coverage actually includes
Industry rankings span culture, technology, logistics, enterprise software, mobility, telecom, healthcare, food and beverage, electronics, ecommerce and fashiontech, startups, Web3 and crypto, fintech, AI and SaaS.
City rankings cover Chicago, Los Angeles, Austin, San Francisco, New York, Miami, Seattle, Denver, San Diego, Dallas and Houston. Region rankings cover Asia-Pacific, USA and Europe.
Why the denominator matters
Forty-nine linked profiles do not mean 49 mutually exclusive agencies in every industry or city ranking. The same studio may appear in multiple topic lists. For any future site-wide cost or review benchmark, the correct process is to deduplicate agencies by profile, keep a fixed observation date, and report the number with a usable value for each metric.
06 / THE UNDERLYING DATA
Global shortlist: full comparison table
The following figures are transcribed from the October 2026 Top Brand Agencies global ranking, with company names standardized for display. Project minimums are in USD.
| Agency | Founded | Min. project | Hourly rate | Total /10 | Reviews /3 |
|---|---|---|---|---|---|
| Clay Global | 2009 | $50,000+ | $150-$199 | 9 | 2 |
| Mission Control | 2025 | Flexible* | $150 | 8 | 1 |
| COLLINS | 2008 | $100,000+ | $200-$300 | 9 | 2 |
| Pentagram | 1972 | $150,000+ | Varies | 9 | 2 |
| Wolff Olins | 1965 | $150,000+ | $200-$300 | 9 | 2 |
| BBDO | 1891 | $250,000+ | Varies | 9 | 2 |
| Dentsu Creative | 2022 | $200,000+ | Varies | 8 | 2 |
| Prophet | 1992 | $150,000+ | Varies | 8 | 2 |
| FutureBrand | 1999 | $150,000+ | Varies | 8 | 2 |
| Mekanism | 2003 | $100,000+ | Varies | 8 | 2 |
| Ragged Edge | 2007 | $75,000+ | $150-$200 | 6 | 1 |
| MetaDesign | 1979 | $100,000+ | Varies | 6 | 1 |
| Further | 2009 | $75,000+ | $150-$250 | 6 | 1 |
Definitions
Minimum project The lowest listed engagement threshold or floor; not the average agency fee.
Hourly rate The published single rate, range, or variable-rate label; not a blended effective rate.
Total score A 10-point editorial judgment using the site methodology; not an independently audited performance measure.
Reviews score An editorial assessment of available client feedback, out of three points.
METHODOLOGY AND SOURCES
How these statistics were calculated
Scope. All charts concerning costs, agency age and editorial scoring use the 13 agencies on the October 2026 Top Brand Agencies global ranking. The website footprint metrics use the agency directory and navigation visible on 8 October 2026. These are editorial datasets, not a random or representative sample of the branding industry.
Pricing. Minimum project figures were interpreted as floors. Twelve numeric floors were available on the global-ranking page. Rates marked “Varies” were treated as non-numeric; a single published hourly figure counted as numeric. The median uses the usual midpoint of the sixth and seventh ordered numeric values.
Editorial scores. Strategy, creative quality and reviews are the publication’s own ratings. The chart counts the number of agencies receiving the maximum in each component; it does not compare independently audited business results.
Quality controls. The data table can be rechecked directly against the links below. Because agencies can change rates, headcount, names and office locations, each edition should retain its observation date. A future complete-directory edition should document missing values and deduplication rules before claiming directory-wide rates.
Primary source links
Global ranking, October 2026: https://topbrandagencies.com/
Agency directory: https://topbrandagencies.com/agency/
Editorial scoring methodology: https://topbrandagencies.com/methodology/
Mission Control profile: flexible budget clarification: https://topbrandagencies.com/agency/mission-control/
Frequently asked questions
What is the typical minimum budget of a top branding agency?
Among the 12 agencies with numeric project floors in the global shortlist, the median listed minimum is $125,000. This is not a typical final project fee.
Are hourly rates widely published?
Six of the 13 agencies publish a numeric hourly figure or range on the global ranking. Seven describe rates as variable.
Do higher scores mean stronger independently proven results?
Not necessarily. Scores are editorial assessments across strategy, creative quality and available reviews. They are not controlled outcome measurements.
Can I use these figures when selecting an agency?
Yes, as directional shortlist benchmarks. Verify current scope, staffing, references and fees with each firm before making a purchasing decision.
Contact Info
Let’s Chat
Need help choosing the right agency?